12/20/2007

AUC vesus Reps reps= [1 2 4 8 16]

auc_reps_mu_1_kk_1.pdf
auc_reps_all_in_1.pdf

Download Figures:
auc_reps_all_in_1.pdf and each separate figures in directory.

Note: Bars are grouped to show AT LEAST how many reps for x-arc is needed to reach some range of AUC value.
For example:
In the first subfigure (mu=1, kk =1), to reach range [0.625, 0.65], 0-arc at least reps =16 is needed, others only need reps =1.

Download AUC_data: arc0_mat; arc1_mat;arc2_mat;arc3_mat
In 1-arc test, auc value is stored by arc1_mat(mu_ind,kk_ind,reps_ind) = auc;
e.g. if mu = 2, kk =3, reps =8, the corresponding index should be arc1(2,3,4).

Setting:
murange = [1 2 4];
kkrange = [1:3];
reps = [1 2 4 8 16];

12/13/2007

AUC vesus Reps

Download:
http://www.cse.buffalo.edu/~juanli/auc_vs_reps/

p.s. mu_p5.pdf contains the legend, others don't have a legend.

Setting:
reps = [1 4 8];
murange = [0.1 0.5 1 2 4 8 12 16];
kkrange = [1:16];
seeds=[1:10];

AUC vesus Reps

Download:
http://www.cse.buffalo.edu/~juanli/auc_vs_reps/

p.s. mu_p5.pdf contains the legend, others don't have a legend.

Setting:
reps = [1 4 8];
murange = [0.1 0.5 1 2 4 8 12 16];
kkrange = [1:16];
seeds=[1:10];

8/30/2007

vsn & E_Coli calculation scripts

Download:
vsn script
E_Coli script
vbssm_v3.3.7

Both scripts are OK on my desktop, but I have no time to modify corresponding paths for your running, sorry.

readme.txt will be helpful, take a look.
-----------------------------------------------------------------------------------
actually what we should do is to run vsn_normalization data with the same priors - please could post your scripts for this ecoli calculation and the vsn_normalization calculation also. I 'll get my new student to look at them while you are away. Maybe we can talk when you return if we have any questions before you start work?

8/21/2007

E_Coli expr

Data is sightly changed on gene 'hns'!

The profile of gene 'hns' is modified to have constant of 0, -20, -100, respectively, after normalization.
---------------------------------------------------------------------------
This gene should have zero expression, which may mean that it should be constant and very low (negative) after normalization, rather than zero. -David

1. F vs kk
Hyper-opt is on_______ Hyper-opt is off
2. Add Posterior(vsn-normalization) as Prior(E_Coli.xls --'no-inter' sheet)

Part of Frequency Table for Shift Subset

Download: FreqTable(PDF): hns = 0, -20, -100
3-in-1 xls file: freq0-20-100.xls

8/16/2007

Prior script

http://www.cse.buffalo.edu/~juanli/Prior_Scripts.rar

norm script

Download:
1. norm_genes.m
2. example_genes.xls

norm_genes contains 3 parts:
1. read xls file
2. normlize data
3. generate input data for vbssm model.

Note:
1. 'example_genes.xls' is generated by extracting first 10 genes from 'E.coli.values.xls'--'no-inter' sheet.
2. There are 2 replicates timeseries , each of 8 timepoints
3. Data is already log-transformed

hns profiles after normalization


--From David------------------------
please could you post a figure of the profiles of gene hns after your normalization? this gene should have zero expression, which may mean that it should be constant and very low (negative) after normalization, rather than zero. we should check

8/03/2007

inter

Part of Frequency Table for Shift Subset
Notes:
1. Shift Subset is defined from Page 16 of Manchester.pdf

2. In muD (prior mean matrix of D), only 12 entries'signs are adjusted, based on the info in memo1. Only these 12 entries are multiplied with mu value (e.g. *0.5), when mu varies. Other entries inherit their sign and value from previous experiment.

3.
10 posterior MEAN matrices for A,B,C, D from the previous experiment (vsn_normalization), with some entries adjusted for the new priors. However, vbssm is unable to run when posterior COVARIANCE is incorporated, since 'trigamma' function will report severe problem to stop computation.
----------------------------------------------------------------------------------
Memo1:Priors
hns-> glpC, glpQ +ve (these appeared in the model network and were confirmed by the experiment)
hns-> cyo D,E,B,A no connection (not confirmed by experiment)
hns -> sdhB -ve (confirmed)
hns-> arcA no connection
hns-> appY -ve (connected confirmed but sign different)
hns-> cad A,B -ve (opposite sign)
hns -> hdeB -ve (opposite sign)
-------------------------------------------------------------------------------
Memo2. Posterior
Expt A, instead of starting with 10 random seeds, you need to start from the 10 posterior matrices for A,B,C, D from the previous experiment (vsn_normalization), with the means and variances adjusted for the new priors, i.e. the posteriors from the previous experiment become the priors for the new experiment.
-------------------------------------------------------------------------------
-----------------------------------------------------------------------------------
Note:
Q: How to present 'no connection' in prior matrix?
A: This is be a prior constrained around zero - i.e mean zero but with very tight distribution (low variance)

8/01/2007

Set Prior Covariance Matrix for A,B,C,D

vbnet examples: mu = 0 (no prior), mu = 0.1 (with prior)

Download: ARD derivation notes

Data: Zak's data

reps = 4;

kk = 6;

arc = 9; (arc 9 is added as prior arc)

---------------------------------------------------------------------------------
Hi Juan

I guess so, how did you specify priors for the ARD prior experiments?
You need to set the mean and variance I guess, which would just be the diagonal of the full covariance matrix.

--
In ARD expr,

where delta = 1*ones(pinp,1) % by default initialization in Matt's code.

So, I only need to set the mean, let variance be default -Juan


I didn't realize the code output the full covaraiances - maybe we can look at the posterior covariances to understand correlation between the parameters as I suggested earlier - can you put some samples from the ARD prior experiments (Zak's data) on the web site?

- See top


Let's try to talk at 8am Friday if that works for you. If not then Thursday 8am would also work for me


- OK, Friday 8am.

David
----------------------------------------------------------------------------------
I happen to realize that, vbssm specifies the Prior Covariance matrix of D as diagonal, not full matrix.
(see the attached derivation Page 2, Equation 7)

But, I have checked that the Posterior Covariance matrix of D obtained from the previous experiment (vsn_normalization) is actually a full matrix. How should we treat it? Is it OK to let the non-diagonal entries be zero, in order to fit the vbssm model?

-Juan

F vs kk for "E_Coli_ no_inter_sheet"

Hyper-opt is on_______ Hyper-opt is off

Download: PDF
Data: E.coli.values.xls, no-inter sheet (normalized by Juan afterwards)
Hyper-optimization = on ( same as vsn-normalization.xls)
its = 2000.

Compared with Figure 5 of Zak's data (below), F_kk figure above seems make sense.
Hyper-opt is on_______ Hyper-opt is off

7/27/2007

vsn_normalization, including 'pnp' profiles


It's good that optimum k stays at 6, after pnp profiles added

including 'pnp' profiles

original

From David,
Experiment B) vsn_normalization

repeat the experiements run earlier (control and shift) but include the expression prifiles for pnp

you should probably rerun F vs K first but I wouldn't expect K to change

7/19/2007

Accumulative vs Non-Accumulative for Zak's Data

Non-Accumutive: reps = 8, kk = 4
Accumutive: reps = 8, kk = 4
Download:
Accumulative figures

Non-Accumulative figures

zak_accu_nonaccu.zip

Data: 'Zak's'.
reps = [1 4 8]; stdrange = [1.66 2.33 3]
kkrange = [1:16]; // According to Matt, we didn't explore optimal kk value for Zak's data
murange = [0 .1 .5 1 2 4 8 12 16 32 64 100];
seedrange = [1:10];

Results are the average of 10 models (seeds).

7/10/2007

Prior Test for "Shift Subset"

Part of Frequency Table for Shift Subset


Download: PriorTest_Shift_subset.pdf

Notes:
1. Shift Subst is defined from Page 16 of Manchester.pdf
2. Priors are defined from Page 15 of Manchester.pdf

4 verified interactions are incorporated as Priors for vbssm model:
hns pd appY
hns pd cadA
hns pd cadB
hns pd hdeB

The other 2 verified interactions do NOT belong to Shift Subset
arcA pd hybB
gutM pd srlR

6/21/2007

Aucroc T = 6 figure

Download: roc_reps4_somek_ho0_allT.pdf

Download: meanaucreps2-4-8-16_ho0_allT.pdf
reps = [2 4 8 16], T = [6 12 120]

Download: aucroc_reps4_k1-16_ho0_allT.pdf
reps = 4, T = [6 12 120]


6/04/2007

Zak data, scripts and our simulated data sets

Download: Zak_Data.zip

Note: Folder "Matt_profiles" contains the script Matt wrote to generate the plot of the noisy versions of the mRNAs.
i.e. 'MA','MB','MC','MD','ME','MF','MG','MH','MJ','MK'

6/02/2007

Accumulative vs Non-Accumulative Priors

Accumulative: for n-th test, block[1:n] are added as prior. Z = 3

Non-Accumulative: for n-th test, only block[n] are added as prior. Z = 3

Download: (Average of 10 seeds)
1. Accumulative results: Z = 1.65, Z = 2.33, Z= 3

2. Non-Accumulative results: Z = 1.65, Z = 2.33, Z = 3
3.Sorted "top50 & reg" as blocks ( PDF / XLS), gray indicated no entry in vsn-normalization.xls

Data: Control network of vsn_normalization.xls
Setting:
k = 6 (optimum);
seedrange = [1:10];
murange = [0 .1 .5 1 2 4 8 12 16 32 64 100];

5/20/2007

Subset recovery for Shift -- Freqency Show

Numbers on the edges represent the number of models from 10 different random seeds
Download: pdf / .sif (with freqency on right)

Data: Shift network of vsn_normalization.xls
Setting: 10 seeds, k = 6 (optimum), mu = 0 (no prior incorporated)

Download: Script
Readme:
1. Run script to get the file containing hit log
Script to Run: "runS_subset_prior_freq.m"

Input:
S_yn.mat
S_inpn.mat
S_inpn.mat
prior_inter.mat

Dependencies:
find_arcs.m

Output:
hitlog/hit_subset


2. Analyze the hit log file
Script to Run : "analyze_hitlog_freq.m"

Input:
hitlog/hit_subset

Output:
freq_Prior_subset_Shift_vsn_top50reg.txt

Format:
from pd to mu= 0 .1 .5 1 2 4 8 12 16 32 64 100

cadB pd cadA 5 9 4 4 5 7 4 2 5 7 4 6

The number behind "cadB pd cadA" indicated this edge occurances among 10 different random seeds models, for different mu.

5/10/2007

'top50 & reg' 'Block-Prior' Freqency Show

Best Case: mu = 0.5 (PDF)


Data: vsn-normalization.xls 'Control' Data

Setting:
murange = [0 .1 .5 1 2 4 8 12 16 32 64 100]; Download all figures while mu varies
10 seeds for vbssm model training

X-label: true arc index
Y-label: frequency of the arc recovered in 10 seeds training

Notes:
1) These figures indicate mu=0.5 are optimal
2) tdcA-arcs are more easily recovered then tdcR-arcs

*The frequency analysis is *AGREE with the previous average analysis.

5/03/2007

'top50 & reg' 'Block-Prior' Average Show


Download: PDF/JPG


Data: vsn-normalization.xls 'Control' Data

Setting:
murange = [0 .1 .5 1 2 4 8 12 16 32 64 100];
10 seeds for vbssm model training

Procedures:
1. Sort 'top50 & reg' as blocks: pdf / xls
2. In k-th experiment, incoporate blocks[1:k] as prior, take the average of 10 seeds for significance computation
3. Analyze the recovered true arcs, Total # = 10.
They are grouped into 2 catogaries: tdcA-arcs & tdcR-arcs, where:

tdcA-arcs:
(color is agree with legend)
tdcA pd tdcB
tdcA pd tdcC
tdcA pd tdcD
tdcA pd tdcE
tdcA pp tdcA

tdcR-arcs: (color is agree with legend)
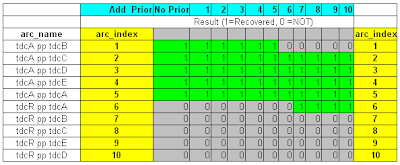
tdcR pp tdcA
tdcR pp tdcB
tdcR pp tdcC
tdcR pp tdcE
tdcR pp tdcD


More details about this work
1. Sort the 'top50 & reg' as blocks.
That means, arcs with same 'from-gene' are grouped as one block, ignore the 'to-gene'.
E.g. The group containing all tdcA-arcs are named block-1, the group containing all tdcR-arcs are named block-2.
block-idx from to
1 tdcA tdcA
1 tdcA tdcB
1 tdcA tdcD
1 tdcA tdcE
1 tdcA tdcF
1 tdcA tdcG
1 tdcA tdcC

2 tdcR tdcA
2 tdcR tdcB
2 tdcR tdcC
2 tdcR tdcE
2 tdcR tdcF
2 tdcR tdcG
2 tdcR tdcD

>From block-3, block-index is numbered by the alphabet order of 'from-genes'

2. Add prior for vbssm training.
There are 29 experiment, since the block # I sort in 'top50®' is exactly 29. Each experiment also explores mu range.
1st test, add all tdcA-arcs (i.e. block-1) as prior
2nd test, keep the tdcA-arcs (block-1) as prior, meanwhile add tdcR-arcs (block-2) as prior.
....
29th test, all arcs (i.e. block(1:29) ) are added as priors.

3. Organize the 29 experiment data, each murange = [0 .1 .5 1 2 4 8 12 16 32 64 100]
Since mu value play an important role in recovery evaluation, I made the figure to reflect this point.

There is no true network at hand, only 10 known arcs. I named them as 2 groups
tdcA-arcs:(from gene = tdcA, to gene = don't care)
tdcA pd tdcB
tdcA pd tdcC
tdcA pd tdcD
tdcA pd tdcE
tdcA pp tdcA

tdcR-arcs:
(from gene = tdcR, to gene = don't care)
tdcR pp tdcA
tdcR pp tdcB
tdcR pp tdcC
tdcR pp tdcE
tdcR pp tdcD

Different colors, blue and pink, to demonstrate 10 true arcs recovery results. Blue = tdcA-arcs, pink = tdcR-arcs.
The bule+pink stack gives the total number of vbssm identified true arcs.

Based on my understanding, figure revealed at least 2 information:
1. mu = 0.5 is optimum mu value, at which # of recovered arcs reaches peak.
2. In global view, pink-arcs only showed with some special mu, whileas, blue-arcs are not significantly affected by mu value.

4/04/2007

ARD Net

figure parameter: 3-arc-idx = 9 , reps=8 , kk = 15
seedrange = [1:10]; murange = [.1 .5 1 2 4 8 12 16];

vbssm output for 3-arc-idx = 9, kkrange = [1:16] is at

'/home/csgrad/juanli/work/log/triplet_128'

Net Name Explanation:
'net_2_arc9_kk15_seed1.mat' means
3-arc-idx = 9, kk = 15, seed = 1, mu = 2;

*p1 = 0.1; p5 = 0.5

--------------------------------------------------------------------------------------------
Juan

I need the vbssm output to be able to look at possible correlations in the CBD matrix. Please can you generate this in the first instance for the model with arc =3, reps=8 and kk = 15 say, the same values that were in the figure 3arc_info_auc that you sent me. Ideally, I would like all models k = 1:16 - these could be in separate .mat files to reduce storage space.

David
---------------------------------------------------------------------------------------------

3/30/2007

Explore mu range on "Contro " of vsn-normalizaion

murange = [0 .1 .5 1 2 4 8 12 16 32 64 100];
10 seeds for vbssm model training

Recovered Result is shown on PDF / XLS

3/26/2007

ARD Data

1-arc: reps = 1 / 4 / 8
2-arc: reps = 1 / 4 / 8
3-arc: reps = 1 / 4 / 8

Each includes matrice trained from10 seeds.

The data structure is organized as:
Sample | reps | arc_ind | kk | mu | auc-val

pair_map.mat gives the pair_index, and triplet_map gives the triplet_index, mapped from 12 single arcs.

see also: ARD Experiment, ARD scipts, ARD results

3/20/2007

ARD Scripts

Collected in http://www.cse.buffalo.edu/~juanli/ard_scripts/

It includes the scripts for ARD experiments.
part 1
run_single_121.m (1-arc prior, sample = 12, reps = 1)
run_single_124.m (1-arc prior, sample = 12, reps = 4)
run_single_128.m (1-arc prior, sample = 12, reps = 8)

run_pair_121 .m (2-arc prior, sample = 12, reps = 1)
run_pair_124 .m (2-arc prior, sample = 12, reps = 4)
run_pair_128 .m (2-arc prior, sample = 12, reps = 8)

run_triplet_121.m (3-arc prior, sample = 12, reps = 1)
run_triplet_124.m (3-arc prior, sample = 12, reps = 4)
run_triplet_128.m (3-arc prior, sample = 12, reps = 8)

part2
some auxilary scripts to calculate auc/roc quantity.
In addition, pair_map.mat gives the pair_index, and triplet_map gives the triplet_index, mapped from 12 single arcs.

part3
readme explains what the various fields in the network structure are

--------------------------------------------------------
Please can you put the matlab files which contain the model parameters for your ARD experiments on the web site also, together with a readme file which explains what the various fields in the network structure are?

3/19/2007

VBSSM Release Issue

vbssm_v3.4.1, including the local/remote running script example is at
http://www.cse.buffalo.edu/~juanli/vbssm341.tgz

1. From David
Please could you check that the latest vbssm software, with prior incorporation is included in the release at

http://www.cse.buffalo.edu/faculty/mbeal/vbssm.html

Chis Miller should be able to help you.

What release version is this? -David
-- This release version is the original version 3.0 (08/11/03) Matt posted. (Juan)

2. From David

Have you worked on any of these yet?

In upcoming releases v3.4+

Provide sample scripts to demonstrate features new in release v3.4. -Yes
Allow missing (unobserved) entire time points in the data (smooth, predict, and feedback). -No
Allow for missing individual dimensions at some time points (sensor failure). -No. (Juan)

3. From David

We need the scripts for cluster usage and some example scripts to be included in the tar file
Please can you make sure this is done before 3/30?
-Yes. Download vbssmv3.4.1

3/13/2007

Example AUC curves to show info arc/k

replicates = 1: 1-arc example / 2-arc example / 3-arc example
replicates = 4: 1-arc example / 2-arc example
replicates = 8: 1-arc example / 2-arc example / 3-arc example

Info Table: pdf / xls

--------------------------------------------------------
Q: shouldn't the y-axis be labelled 'delta auc' ?

A: It is the original "auc" curve to show ROC-C better than ROC-B, Whereas the delta-auc curve is aimed to compare the increase quantity among 1-arc, 2-arc and 3-arc priors.

3/08/2007

F_vs_K Plot on 'vsn-normalization.xls' -- Adding prior


Recovered Network (PDF) Threshold = 1.6

Recovered Network (PDF) Threshold = 3


Data: vsn-normalization.xls. ONLY Control network
Steps:
1. Adding 1 known connection as prior each time. Total is 10 tests, coming from 10 connections.
2. Retrain vbssm model and find optimal K value (10 retrainings all show k = 6 is the optimum)
3. Compare the recovered network with the known connections

Notes:
1." tdcF" and "tdcG" have *No* Entries in vsn-normalization.xls. Therefore, the following 4 intersections,
tdcA pp tdcF
tdcA pp tdcG
tdcR pp tdcF
tdcR pp tdcG
are excluded in the prior-test. There are 10 known connetions as prior candidates.
2. In CBDioZ, threshold = 1.6 / 3, consistent with that in the previous no-prior test.


------- Original Email --------------
Juan
I looked at your results. I see a few of the known connections in
top50®.sif in any of the reconstructed Control network. For instance,

tdcA pd tdcB
tdcA pd tdcC
tdcA pd tdcD
tdcA pd tdcE

are ok but the following are missing

tdcA pp tdcA
tdcA pp tdcF
tdcA pp tdcG


tdcR pp tdcA
tdcR pp tdcB
tdcR pp tdcC
tdcR pp tdcE
tdcR pp tdcF
tdcR pp tdcG
tdcR pp tdcD

You need to cross-check the .sif files carefully to see what is correct.

What I suggest is that we concentrate on the Control network for now, and start to add the known connections in top50&reg.sif as priors. You might want to do these 1 regulator at a time, and retrain the vbssm models. I guess you will need to repeat the F vs K plots first. What we ought to see is that known connections persist in the models.

By the way ihfAihfB pp tdcA should be

ihfA pp tdcA
ihfB pp tdcA

etc.

Please let me know if you have any questions about this.


Thanks

David

3/05/2007

F_vs_K Plot on Vichy's Data


Vichy Data (70 genes) PDF
Linda,

Matrics File
for vichy's data: yn.mat and inpn.mat

-Juan

-----------------------------------------------------------------
Linda

I looked at the plot and it looks fine.

The message below the plot suggests a matalb version problem. Can you
check if this is the problem?

You should now be able to proceed with producing a model for k =8 .

Maybe Juan has the matlab matrix file already and she can post it on the
website

David
-----------------------------------------------------------------------------------
Hi, David and Linda


This is the F vs K plot (10 seeds). k=8 is the optimum.

I had no trouble generating matrics (yn.mat and inpn.mat). I looked into the xls file and found from line 32 there are some notations following numerical data in the same row. I'm guessing the problem is probably coming from the function 'xlsread'. Is your MATLAB too old? I'm using MATLAB 7.0.1.

-Juan
--------------------------------------------------------------------------
Juan
Would you be able to help Linda debug this? I won't have any time to look
at it before next week. First key steps would be to produce F vs K plots
for this data. I don't un derstand what Linda means by "it would only
accept 31 out of the 70 genes".

Many thanks

David


---------- Forwarded message ----------
Date: Fri, 2 Mar 2007 17:05:25 -0000
From: "Hughes, Linda"
To: "'D.L.Wild@warwick.ac.uk' (E-mail)"
Cc: "B-Wollaston, Vicky"
Subject: modelling

Hi david

i ran vickys data through the modelling scripts. The bad news is that it
would only accept 31 of the 70 genes i wanted to put through to generate the
matrices. im not sure if this is a problem with the excel file or matlab as
i re-created the excel file a number of times but it still wont work.
i wonder if you could run the script with this excel file on your laptop so
i know where the problem is coming from.


<> <>

i decided to carry on with the 31 that would work and have run the FSvskk
script without any problem, heres a pdf of the output with a single seed (i
will put everything on the weblog when i come back) just ignore the control
data on the left. it seems that matrix 6 is the optimum.

<>

i was also wondering if you would send me a screen dump of the commands you
used to run CBDioZ after you loaded the relevant matrix for the example data
as being a newbie to matlab, im still struggling with syntax issues; im
particularly interested in the Imagesc command to view the interactions.
lastly im now connected to the buffalo servers and have been trying to run
theFSvskk script using the cluster, i was wondering if you new whether
matlab is installed on the server or whether i need to run it another way?
else i can just ask the buffalo people

sorry bout the long email, i just needed to ask everything before i go on
holiday and give you an idea of the current state of play

thanks

linda

Convert CBD matrix to Cytoscape Network

Linda,
common_gene_names.mat includes the gene names file convCyto_top50®.m reads.

load common_gene_names.mat
then the 56 genes(top50 & reg) names will show up.

> Please can you send Linda the gene names file that convCyto.m reads - in the example script it is '6reps_genenames_only.txt'? I guess you must have created this.

> David

2/26/2007

Network out of top50®.sif

Cytoscape network (PDF) out of top50&reg.sif

2/23/2007

Cyto files for "top50" and "top50+regs" ---- vsn

Data: vsn-normalization.xls
Setting:
1. k = 6 % optimal k
2. seeds = [1:10] % get average CB+D matrix to generate network
3. sds = 3 % default CBDioZ threshold

top50 + reg : **Control ( .sif / .eda / .pdf ) **Shift ( .sif / .eda / .pdf )

top50: **Control ( .sif / .eda / .pdf ) **Shift ( .sif / .eda / .pdf )

2/22/2007

Data.xls vs. vsn-normalization.xls


vsn: top50 + reg (Control + Shift) pdf


vsn: top50 (Control + Shift) pdf


Data.xls: top50 + reg (Control + Shift) pdf


Data.xls: top50 (Control + Shift) pdf

Data is normalized to produce these plots.

2/16/2007

F_vs_K Plot on 'Data.xls'


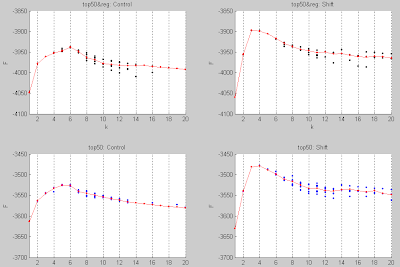
Upper : top50 & reg (Control + Shift)
Lower: top50 (Control + Shift)
Download: PDF

Hi David,

I just finished the experiment. As you said this morning, there are 50 unique genes and 12 regulators, total is 62. However, Data.xls contains only 56 item entries, so I used these 56 genes/regs for vbssm trainning.

The attached includes results of 'top50'(yesterday) and 'top50 & reg' (today) for comparison.

The tarball is the lastest F_kk scripts with detailed comments, plus vbssm toolbox. I have tested on both local and cluster. Linda should be able to run on her laptop directly. For cluster running, she has to carefully check the working paths first. If she has any question, feel free to contact me.

Lastly, thank you very much for considering me to carry on our project. It has been a pleasure to work with you.

All the best,

-Juan
(Local Data Folder: Fkk0213)

2/15/2007

top50®.sif --- Info

I have manually corrected parsing error in 'top50&reg.sif', and imported into Cytospace.

# of unique genes (right-hand column) : 55

# of unique regulators (left-hand column) : 29
# of unique genes & regulators (left+right) : 64
# of regulation arcs: 195

They agree with the information provided by Cytoscape:
64 nodes + 195 arcs

top50.xls vs. top50®.sif

Left side = top50.xls, ( by Shabnam)
Right side = 55 unique genes in right-hand column of top50&reg.sif ( by Juan)

Comparison Info:
34 match
16 left side only
21 right side only

Data Set 02/15

Hi Juan

Here are the original files Shabnam used. It seems that vsn_normalization.xls is the original file, so you might want to write your own script to extract the gene time profiles from that one directly. Please rerun the F vs K plots with these.

Please can you also check that the gene names in top50.xls are actually the genes in the right hand column of top50®.sif?

Thanks

David


-----Original Message-----
From: Shabnam Moobedmehdiabadi
Sent: Wed 2/14/2007 15:04
To: David Wild
Cc:
Subject: Data Sets

Dear David,

The vsn-normalization file is the original normalized data with 2 technical replicates each has 3 rep. I used combine.m script to combine the data to have 6 rep for each gene. I saved the result in timecourse.xls file. I used timecourse.xls file for timecourse analysis finding the HotellingT2 value for each gene.
the ready.xls file is timecourse.xls file which has been sorted on HotellingT2 value. I used the top 50 genes in ready.xls file for vbssm training which I saved them in top50.xls. this is the file that I used to produce figure 3 in the NSF report. normalize.xls is the same data but I did standard normalized transform as well.

About the new set of genes 50genes+regulators, I extracted the genes and the relative expressions from timecourse.xls files and I saved it as ready_top50&reg.xls (in alphabetical order). I extracted the 50genes+regulators name from top50®.sif (which is the same as the figure in networktop50&reg.tiff ) file as you sent to me. As I examined the genes names I figured out that the Yellow circles genes in networktop50&reg.tiff are the same genes as in top50.xls file but the with circles are not included in top50.xls file.

Please let me know if my explanations are not clear.

Best regards,
Shabnam

2/14/2007

F_vs_K Plot on 'vsn-normalization.xls'

Plots are weird and totally wrong due to the mistake of extracting data. Forget these figures

top50 & reg (normalized):
Download: PDF

top50 & reg (not-normalized)
Download: PDF

1. Reshape XLS File ...
# of Item Entries: 4295
Extract Control & Shift Data ...Done!

2. Count Unique Gene/Regs in 'top50&reg.sif' (corrected by Juan)...
# of Unique Genes: 55
# of Unique Regulators: 29
# of Unique Genes & Regulators: 64

**Genes = right-hand column of 'top50& reg.sif'
**Regulators = left-hand column of 'top50& reg.sif'

3. Find Genes/Regulators shown in both .sif and .xls files ...
# of Item Entries in xls file: 4295
a) Common Genes ...
# of Unique Genes in 'top50&reg.sif': 55
# of Genes hit: 50
b) Common Regulators ...
# of Unique Regulators in 'top50®.sif': 29
# of Regulators hit: 23
c) Common Genes & Regulators ...
# of Unique Genes + Regs in 'top50®.sif': 64
# of Genes + Regs hit: 56

4. Generate inpn/yn data...Done.
5. Train VBSSM (10 seeds on cluster)
6. Plot F_K (see top) : normed vs. non-normed

(Local Data Folder: Fkk0215/non-normed & Fkk0216/normed)

1/25/2007

ARD Results

Model Parameters:

time_window = [600 3480]; % ideal time window 600-3000(min) == 10-50(hr)
sample = 12; % time points

noise = 0.1; % set noise to 10%
vbits = 300; % maximum it#,iterations

kkrange = [1:16]; % hidden state dimension
stdrange = [0.5:0.5:10]; % standard deviation range to produce ROC curve
murange = [.1 .5 1 2 4 8 12 16]; % magnitude of the mean of ARD prior

Target 1: Compare the AUC improvement of 1-arc,2-arc and 3-arc (10 seeds)
1-a) replicates = 1: kk_range = [1:16] / 16-in-1
1-b) replicates = 4: kk_range = [1:16] / 16-in-1
1-c) replicates = 8: kk_range = [1:16] / 16-in-1
1-d) reps = [1 ; 4; 8]: kk_range = [1:16]

Target 2: Capture Informative Interaction (arc) / k
Informative arc/k is defined if it helps priored-auc better than corrected-auc

2-a) Info Table: pdf / xls
2-b) replicates = 1: arc/k statistics in bar-chart or hit the common Informative arc / k
2-c) replicates = 4: arc/k statistics in bar-chart or hit the common Informative arc / k
2-d) replicates = 8: arc/k statistics in bar-chart or hit the common Informative arc / k

1/15/2007

ARD Experiments

Hello David.

Here is the experiment I have currently tasked Juan Li with:

[mu is the location of the ARD prior's mean, and is a matrix]

1) mu=0, set random seed, run SSM, obtain ROC curve ROC-A.
2) choose an arc r->s which SSM doesn't get right at all.
3) plot ROC curve B, ROC-B, obtained from ROC-A but where arc r->s is
manually corrected.
4) rerun SSM (from same random seed as above), with mu_{r,s} =
[0 .1 .5 1 2 4 8 12 16]
5) in each case plot the new ROC curve C, {ROC-C}_{mu_{r,s}
=0 .1 .5 1 2 4 8 12 16}.

By construction, ROC-B must be at least as good as ROC-A.

Without local minima issues, we would hope that ROC-C were better
than ROC-A.
But we would hope that ideally ROC-C is better than ROC-B, which
would show that providing information about r->s provides *more than
just this isolated help*.

Will follow up on the discussion we had about the knock-out.
-Matt

1/12/2007

RUN safely on "underground"

Introduction:
Tube is a 34-processor cluster, owned by Dr. Beal and administered by CSE, available to members of his group for algorithm prototyping. Each node has 2GB ram, 80GB hd, and dual core 3.2GHz Intel Xeon processors. underground.cse.buffalo.edu is the head-node, accessible only via ssh. Matlab is available with the Distributed Computing Toolbox.

Tips to follow up:
1. Make sure you can run the script on local machine first. It's hard for us to terminate a bad heavy job on cluster. I have no such authority.
2. Write a LOG file to know where you may get stuck.
3. Save resulting variable with huge size into a FILE, instead of returning it directly. I lost results before by returing a big variable, it's probably caused by nasty Java vm.
4. After creating a folder on cluster, make sure it is writable, or you will not be able to write into files. I use cmd 'chmod 777 foldername'.

How to run on underground?
1. Invoke matlab
>matlab
2. Specify absolute pathes to tell the workers where to load script and write log.
> pppp = {'/home/csgrad/juanli/work/toolkits/vbssm_v3.3.5',...
'/home/csgrad/juanli/work/code'};
3. Enjoy the underground trip
> tic; s = dfeval(@func,num2cell(1),'PathDependencies',pppp);toc;

Examples are available at http://www.cse.buffalo.edu/~juanli/scripts
MATLAB online DCT help