2/16/2007
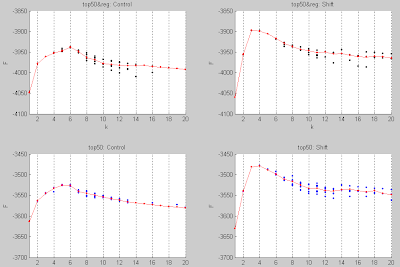
F_vs_K Plot on 'Data.xls'
Upper : top50 & reg (Control + Shift)
Lower: top50 (Control + Shift)
Download: PDF
Hi David,
I just finished the experiment. As you said this morning, there are 50 unique genes and 12 regulators, total is 62. However, Data.xls contains only 56 item entries, so I used these 56 genes/regs for vbssm trainning.
The attached includes results of 'top50'(yesterday) and 'top50 & reg' (today) for comparison.
The tarball is the lastest F_kk scripts with detailed comments, plus vbssm toolbox. I have tested on both local and cluster. Linda should be able to run on her laptop directly. For cluster running, she has to carefully check the working paths first. If she has any question, feel free to contact me.
Lastly, thank you very much for considering me to carry on our project. It has been a pleasure to work with you.
All the best,
-Juan
(Local Data Folder: Fkk0213)
2/15/2007
top50®.sif --- Info
I have manually corrected parsing error in 'top50®.sif', and imported into Cytospace.
# of unique genes (right-hand column) : 55
# of unique regulators (left-hand column) : 29
# of unique genes & regulators (left+right) : 64
# of regulation arcs: 195
They agree with the information provided by Cytoscape:
64 nodes + 195 arcs
# of unique genes (right-hand column) : 55
# of unique regulators (left-hand column) : 29
# of unique genes & regulators (left+right) : 64
# of regulation arcs: 195
They agree with the information provided by Cytoscape:
64 nodes + 195 arcs
top50.xls vs. top50®.sif
Left side = top50.xls, ( by Shabnam)
Right side = 55 unique genes in right-hand column of top50®.sif ( by Juan)
Comparison Info:
34 match
16 left side only
21 right side only
Right side = 55 unique genes in right-hand column of top50®.sif ( by Juan)
Comparison Info:
34 match
16 left side only
21 right side only
Data Set 02/15
Hi Juan
Here are the original files Shabnam used. It seems that vsn_normalization.xls is the original file, so you might want to write your own script to extract the gene time profiles from that one directly. Please rerun the F vs K plots with these.
Please can you also check that the gene names in top50.xls are actually the genes in the right hand column of top50®.sif?
Thanks
David
-----Original Message-----
From: Shabnam Moobedmehdiabadi
Sent: Wed 2/14/2007 15:04
To: David Wild
Cc:
Subject: Data Sets
Dear David,
The vsn-normalization file is the original normalized data with 2 technical replicates each has 3 rep. I used combine.m script to combine the data to have 6 rep for each gene. I saved the result in timecourse.xls file. I used timecourse.xls file for timecourse analysis finding the HotellingT2 value for each gene.
the ready.xls file is timecourse.xls file which has been sorted on HotellingT2 value. I used the top 50 genes in ready.xls file for vbssm training which I saved them in top50.xls. this is the file that I used to produce figure 3 in the NSF report. normalize.xls is the same data but I did standard normalized transform as well.
About the new set of genes 50genes+regulators, I extracted the genes and the relative expressions from timecourse.xls files and I saved it as ready_top50®.xls (in alphabetical order). I extracted the 50genes+regulators name from top50®.sif (which is the same as the figure in networktop50®.tiff ) file as you sent to me. As I examined the genes names I figured out that the Yellow circles genes in networktop50®.tiff are the same genes as in top50.xls file but the with circles are not included in top50.xls file.
Please let me know if my explanations are not clear.
Best regards,
Shabnam
2/14/2007
F_vs_K Plot on 'vsn-normalization.xls'
top50 & reg (normalized):
Download: PDF top50 & reg (not-normalized)
Download: PDF1. Reshape XLS File ...
# of Item Entries: 4295
Extract Control & Shift Data ...Done!
2. Count Unique Gene/Regs in 'top50®.sif' (corrected by Juan)...
# of Unique Genes: 55
# of Unique Regulators: 29
# of Unique Genes & Regulators: 64
**Genes = right-hand column of 'top50& reg.sif'
**Regulators = left-hand column of 'top50& reg.sif'
3. Find Genes/Regulators shown in both .sif and .xls files ...
# of Item Entries in xls file: 4295
a) Common Genes ...
# of Unique Genes in 'top50®.sif': 55
# of Genes hit: 50
b) Common Regulators ...
# of Unique Regulators in 'top50®.sif': 29
# of Regulators hit: 23
c) Common Genes & Regulators ...
# of Unique Genes + Regs in 'top50®.sif': 64
# of Genes + Regs hit: 56
4. Generate inpn/yn data...Done.
5. Train VBSSM (10 seeds on cluster)
6. Plot F_K (see top) : normed vs. non-normed
(Local Data Folder: Fkk0215/non-normed & Fkk0216/normed)
Subscribe to:
Posts (Atom)